Six Statistics on Logistics Globalization
Last year we wrote about the logistics of globalization, examining the challenges that 3PL providers face whether goods from the next state over, or a country on the other side of the world.
That proved to be one of our more popular posts, so we thought we'd see what things look like almost a year on.
Rather than delve into any one topic (which we'll probably end up doing in several future posts anyway!), though, here's a look at global logistics through the lens of statistics.
Six Statistics Reflecting the State of Global Logistics
1. The top five U.S. trading partners in terms of cargo containers in 2009 were all Asian countries, of which China accounted for almost half (48%) of the shipments in question. This means that American trade with China has almost doubled since the turn of the century. [Source: RITA, 2011]
2. Containerisation was associated with an increase in bilateral trade of 790% over 20 years. A bilateral free-trade agreement, by contrast, boosted trade by just 45% in the same period. Membership of GATT raises it by 285%. In other words, containers have boosted logistics globalization significantly more than trade agreements in the past 50 years. [Source: The Economist, 2013]
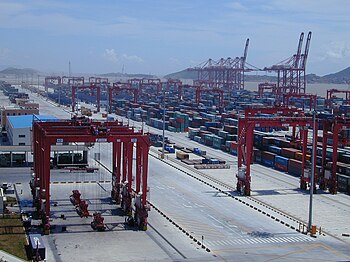
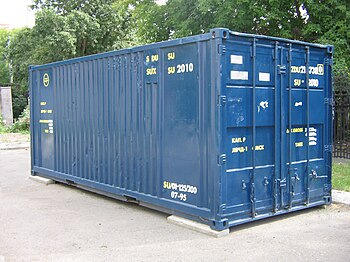
3. On a typical weekday, U.S. container ports handle around 70,000 TEUs (twenty foot equivalent unit containers - see right) of freight from all around the world. [Source: RITA, 2011]
4. Container ships seem to get larger every year. The biggest container vessel currently sailing the seas can hold a whopping 18,000 TEU [Source: BBC, 2013]. Contrast that with statistic number 3 and multiply it by hundreds of bustling ports in countries across the globe. That's a lot of cargo on the move on any one day!
5. Expenditure on U.S. logistics was $1.1 trillion in 2009, which is larger than the national GDP of every country in the world, except for the top 12. [CSCMP,2009]
6. Container trade with the top 10 countries made up nearly three-quarters (71
percent) of global import container shipments and over half (56%) of exported container shipments. [Source: RITA, 2011]
Which stats strike you as the most representative of global economic expansion and logistics globalization?
Let us know on Facebook or Twitter!